Why This Project
I started with buying an EIGHTREE Smart Plug with power monitoring from Amazon. It was meant to measure the power consumption of my kids’ gaming PCs.
The device worked well, but the accompanying app required a €30/year subscription to access historical usage data. That didn’t sit right with me. I knew the device was Tuya-based, so I decided to take back control.
What started as a simple curiosity project quickly grew into a deep dive into smart device internals, embedded protocols, and open observability tools. It turned out these little plugs have a lot of hidden potential especially if you’re willing to do a bit of reverse engineering and Kubernetes tinkering.
Background
We all have devices running 24/7, and often we don’t know what they cost us. This was my motivation to educate myself (and my kids) about energy consumption in a fun and geeky way. This journey mixes reverse engineering, home automation, and cloud-native tooling.
What We’ll Build
A Kubernetes-based system that:
- Reads real-time power usage from the Tuya-based smart plug
- Logs power, voltage, and current to InfluxDB
- Visualizes usage, cost, and trends with Grafana dashboards
Step-by-Step: From Smart Plug to Grafana Dashboard
1. Extracting the Local Key from the Smart Plug
Tuya devices are identified by:
device_idlocal_key
To extract these, I installed an older version of the Smart Life app (3.6.1) on a rooted Android phone. This version stores credentials unencrypted.
The file you need:
/data/data/com.tuya.smartlife/shared_prefs/references_global_key<something>.xml
There you will find both devId and localKey.
2. Understanding the Protocol
Tuya LAN protocol uses a JSON-like payload over TCP (default port 6668) with AES encryption. Luckily, the tinytuya library handles all that for you.
Tinytuya communicates with the device over your local network without cloud interaction, as long as you:
- Know the IP address of the plug
- Have the device ID and local key
3. Running a Polling Script in Kubernetes
We created a Python script that logs power usage every 10 seconds and pushes it to InfluxDB.
The key settings (like device ID and interval) are configured via environment variables.
main.py
import tinytuya
import os
import time
from datetime import datetime, timezone
from influxdb import InfluxDBClient

DEVICE_ID = os.environ["TUYA_DEVICE_ID"]
LOCAL_KEY = os.environ["TUYA_LOCAL_KEY"]
IP_ADDRESS = os.environ["TUYA_DEVICE_IP"]
POLL_INTERVAL = int(os.environ.get("POLL_INTERVAL", 10))
INFLUX_HOST = os.environ["INFLUX_HOST"]
INFLUX_PORT = int(os.environ.get("INFLUX_PORT", 8086))
INFLUX_DB = os.environ["INFLUX_DB"]

plug = tinytuya.OutletDevice(DEVICE_ID, IP_ADDRESS, LOCAL_KEY)
plug.set_version(3.3)

client = InfluxDBClient(host=INFLUX_HOST, port=INFLUX_PORT)
client.switch_database(INFLUX_DB)

while True:
    data = plug.status().get("dps", {})
    power = data.get("19", 0) / 10
    voltage = data.get("20", 0) / 10
    current = data.get("18", 0) / 1000

    point = [{
        "measurement": "power_log",
        "fields": {
            "power": power,
            "voltage": voltage,
            "current": current
        },
        "time": datetime.now(timezone.utc).isoformat()
    }]

    client.write_points(point)
    print(f"[{datetime.now()}] Logged: {power}W, {voltage}V, {current}A")
    time.sleep(POLL_INTERVAL)
4 . Log Power Data with TinyTuya
I used Python and TinyTuya to fetch data from the plug.
5. Dockerize the Script
A small Python script pulls power, voltage, and current every 10 seconds, and writes to InfluxDB.
- The script takes configuration via environment variables
- It’s containerized with a minimal Docker image (based on Python Slim)
Here’s the Dockerfile used to build the container image that runs the TinyTuya polling script:
FROM python:3.11-slim

WORKDIR /app

COPY requirements.txt ./
RUN pip install --no-cache-dir -r requirements.txt

COPY tuya_logger.py ./

CMD ["python", "tuya_logger.py"]
requirements.txtincludestinytuya,influxdb, and optionallyscheduleif used.- The main script (
tuya_logger.py) is responsible for fetching the readings and pushing them to InfluxDB.
Environment variables used:
DEVICE_ID– your Tuya device IDLOCAL_KEY– the device key you extractedPLUG_IP– IP address of the plugINTERVAL– polling interval in seconds (e.g.10)INFLUX_HOST,INFLUX_PORT,INFLUX_DB, etc.
6. Kubernetes Deployment
deployment.yaml
apiVersion: apps/v1
kind: Deployment
metadata:
  name: tuya-logger
spec:
  replicas: 1
  selector:
    matchLabels:
      app: tuya-logger
  template:
    metadata:
      labels:
        app: tuya-logger
    spec:
      serviceAccountName: tuya-sa
      containers:
        - name: tuya-logger
          image: git.ictq.xyz/sneekes-solutions/tuya-k8s-logger:v0.0.2
          env:
            - name: TUYA_DEVICE_ID
              valueFrom:
                secretKeyRef:
                  name: tuya-config
                  key: TUYA_DEVICE_ID
            - name: TUYA_LOCAL_KEY
              valueFrom:
                secretKeyRef:
                  name: tuya-config
                  key: TUYA_LOCAL_KEY
            - name: TUYA_DEVICE_IP
              value: "10.5.0.39"
            - name: TUYA_INTERVAL
              value: "10"
            - name: INFLUX_HOST
              value: "influxdb.influxdb"
            - name: INFLUX_PORT
              value: "8086"
            - name: INFLUX_DB
              value: "tuya-k8s-logger"
            - name: INFLUX_USER
              valueFrom:
                secretKeyRef:
                  name: tuya-config
                  key: INFLUX_USER
            - name: INFLUX_TOKEN
              valueFrom:
                secretKeyRef:
                  name: tuya-config
                  key: INFLUX_TOKEN
          volumeMounts:
            - name: secrets-store-inline
              mountPath: "/mnt/secrets-store"
              readOnly: true
      volumes:
        - name: secrets-store-inline
          csi:
            driver: secrets-store.csi.k8s.io
            readOnly: true
            volumeAttributes:
              secretProviderClass: "tuya-spc"
service-account.yaml
apiVersion: v1
kind: ServiceAccount
metadata:
  name: tuya-logger
secret-provider-class.yaml
apiVersion: secrets-store.csi.x-k8s.io/v1
kind: SecretProviderClass
metadata:
  name: tuya-spc
spec:
  provider: {{ .Values.providerName }}
  secretObjects:
    - data:
        - key: INFLUX_TOKEN
          objectName: INFLUX_TOKEN
        - key: INFLUX_USER
          objectName: INFLUX_USER
        - key: TUYA_DEVICE_ID
          objectName: TUYA_DEVICE_ID
        - key: TUYA_LOCAL_KEY
          objectName: TUYA_LOCAL_KEY
      secretName: tuya-config
      type: Opaque
  parameters:
    vaultAddress: {{ .Values.vaultAddress }}
    vaultKubernetesMountPath: "kubernetes/lab"
    roleName: "tuya"
    objects: |
      - objectName: "INFLUX_TOKEN"
        secretPath: "secret/tuya"
        secretKey: "INFLUX_TOKEN"
      - objectName: "INFLUX_USER"
        secretPath: "secret/tuya"
        secretKey: "INFLUX_USER"
      - objectName: "TUYA_DEVICE_ID"
        secretPath: "secret/tuya"
        secretKey: "TUYA_DEVICE_ID"
      - objectName: "TUYA_LOCAL_KEY"
        secretPath: "secret/tuya"
        secretKey: "TUYA_LOCAL_KEY"
No persistent storage needed.
6. Network Access
Since the plug is on a separate VLAN, I created a firewall rule on my UDM Pro:
- Allowed traffic from the k3s VLAN to the plug IP over port 6668
- This enabled the container to reach the smart socket directly
7. Storing Data in InfluxDB
We used InfluxDB 1.8 (still widely used and compatible with Grafana).
Initial setup:
CREATE DATABASE "tuya-k8s-logger" WITH DURATION 1825d REPLICATION 1 NAME "rp_5y";
8. Grafana Dashboard
This is where it all came together:
- Created real-time gauges for Power, Voltage, Current
- Added daily, monthly, yearly kWh consumption
- Calculated energy costs using a fixed price of €0.3576/kWh
- Included a static correction of 0.76 kWh for missing startup data using Grafana transformations
Example query for cost:
SELECT integral("power", 1h) / 1000 * 0.3576 AS "Cost EUR" FROM "power_log" WHERE $timeFilter
With transformations to add a fixed base and multiply by cost.
Example dashboard: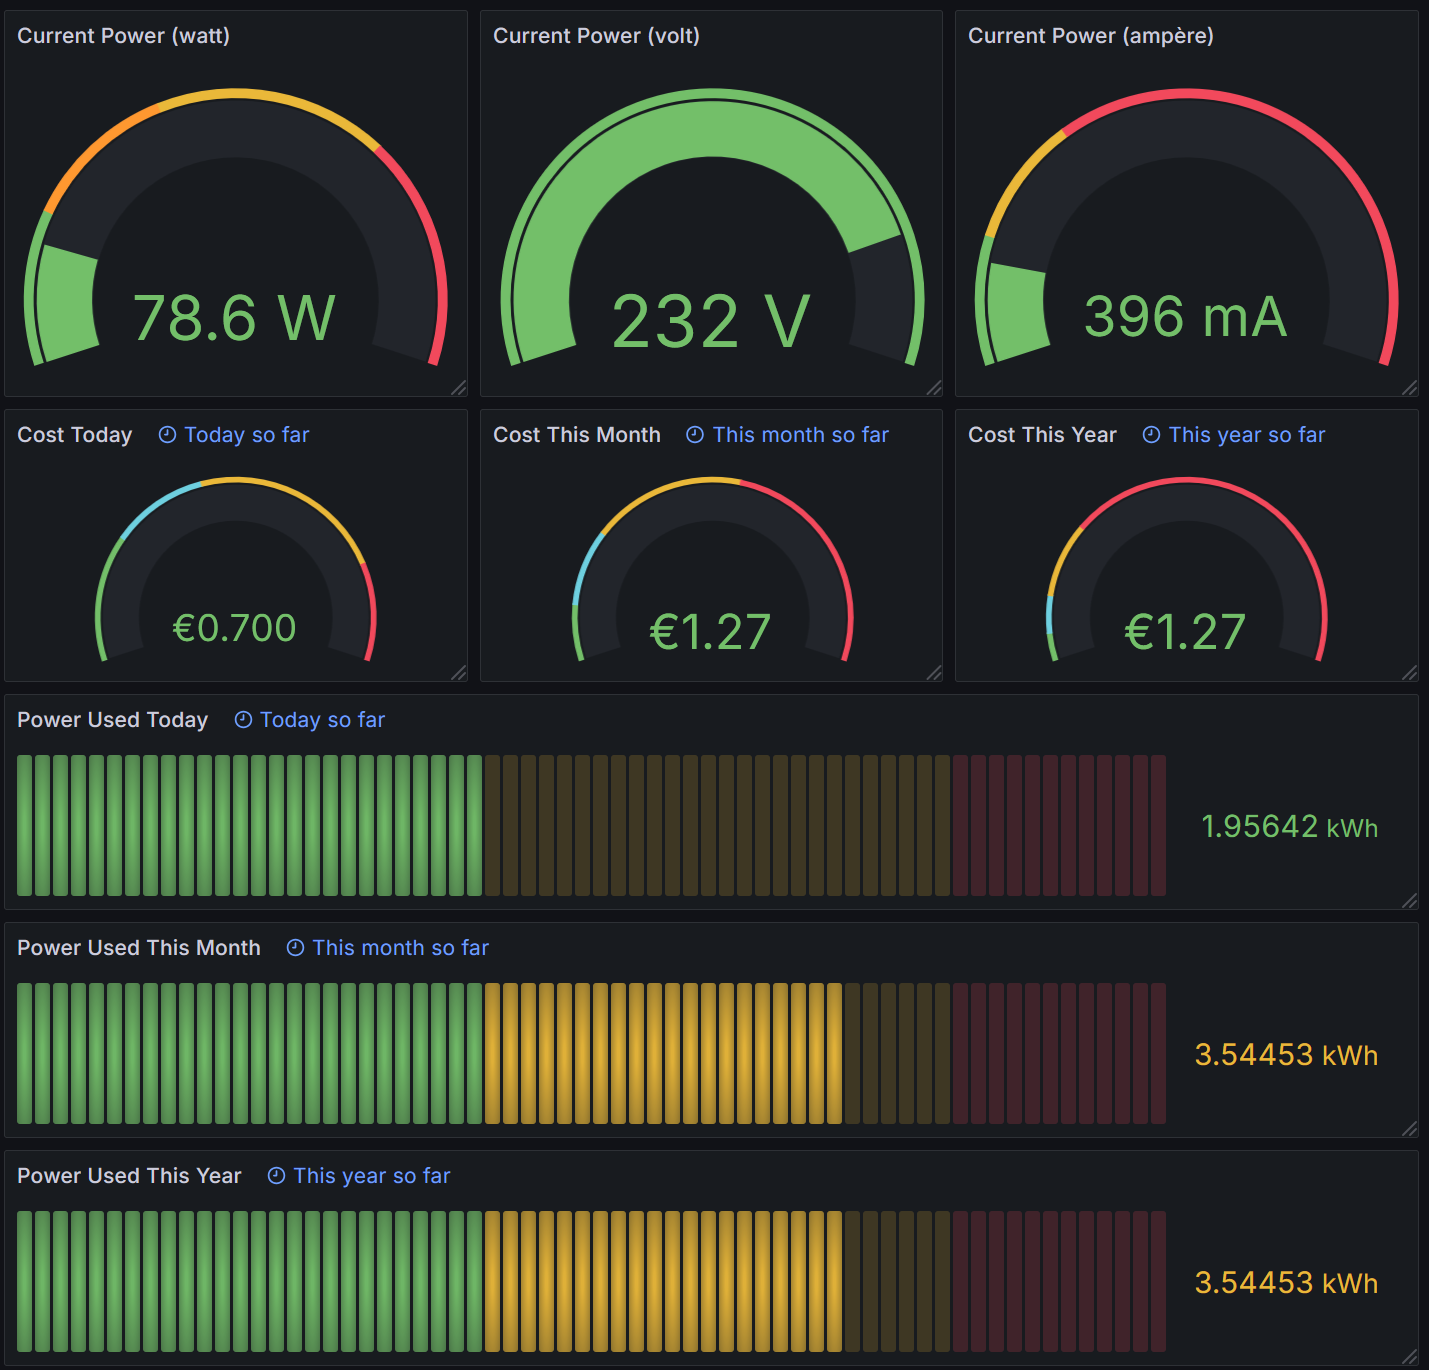
The Result
From a plug with a closed ecosystem and a paywall, to a fully open-source stack running in Kubernetes with real-time power insights in Grafana. All local, all yours. Best of all? It’s private, self-hosted, and usable.
Learnings
- Tuya’s local protocol is very usable when you have the keys.
tinytuyais a great tool, but not officially supported.- Smart plugs can be extremely informative when combined with Influx + Grafana.
- You can build a complete IoT observability platform for zero ongoing cost.
Happy Learning! ⚡